
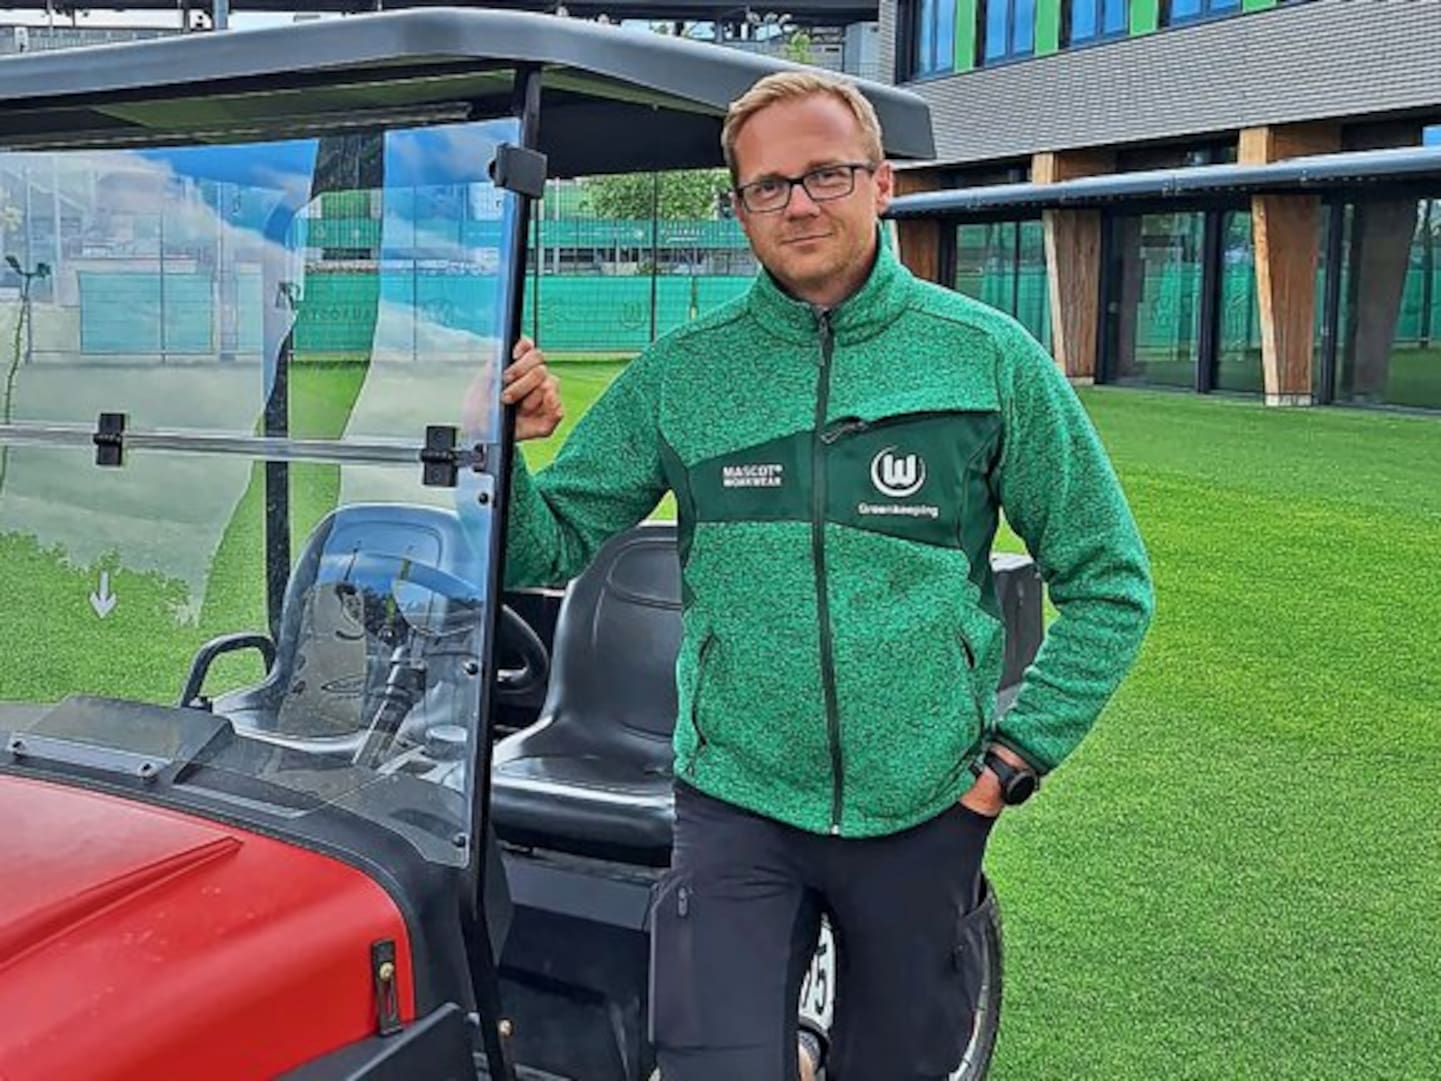
Pitch quality and resource use belong together.
VfL Wolfsburg has described its work with turfcoach as part of its approach to sustainable pitch care. The club’s account connects digital information with decisions about the resources used to maintain the playing surface.
For Jan Naumann, that wider ambition began with a very local question: how could the weather information already available at the club become more useful for the training pitches? A station on site was an existing source of information. Connecting it to the software created the starting point.
This is a practical way into digital groundskeeping. The team brings its knowledge of the site and its existing equipment; the software helps turn those inputs into information that can be checked while planning the work.
Start with the weather on site.
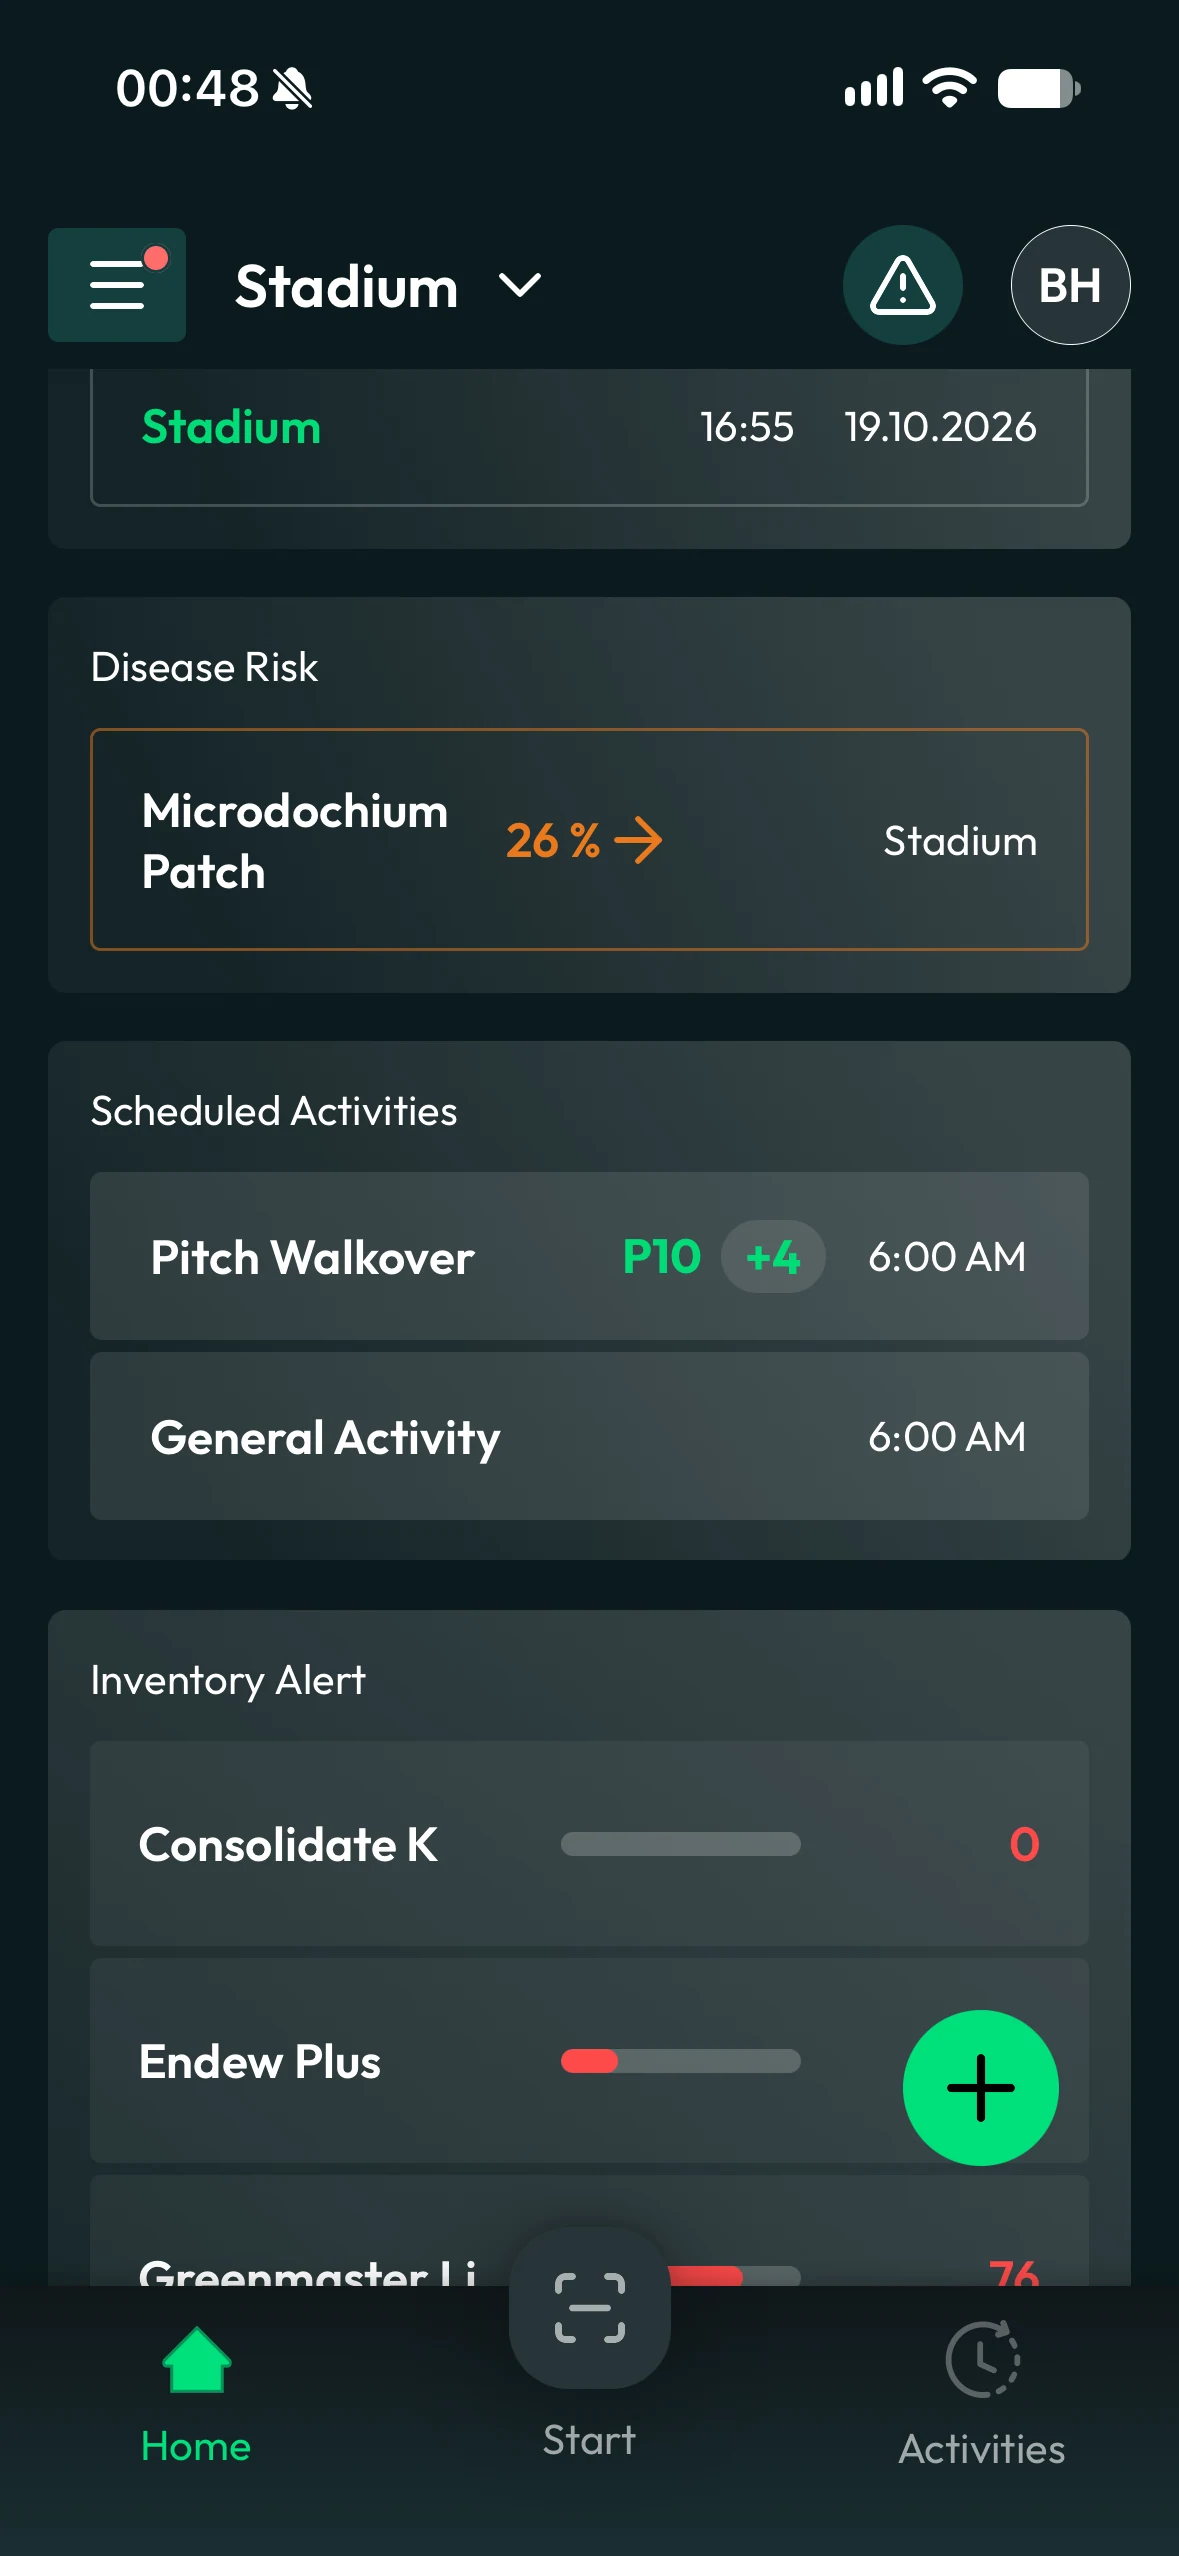
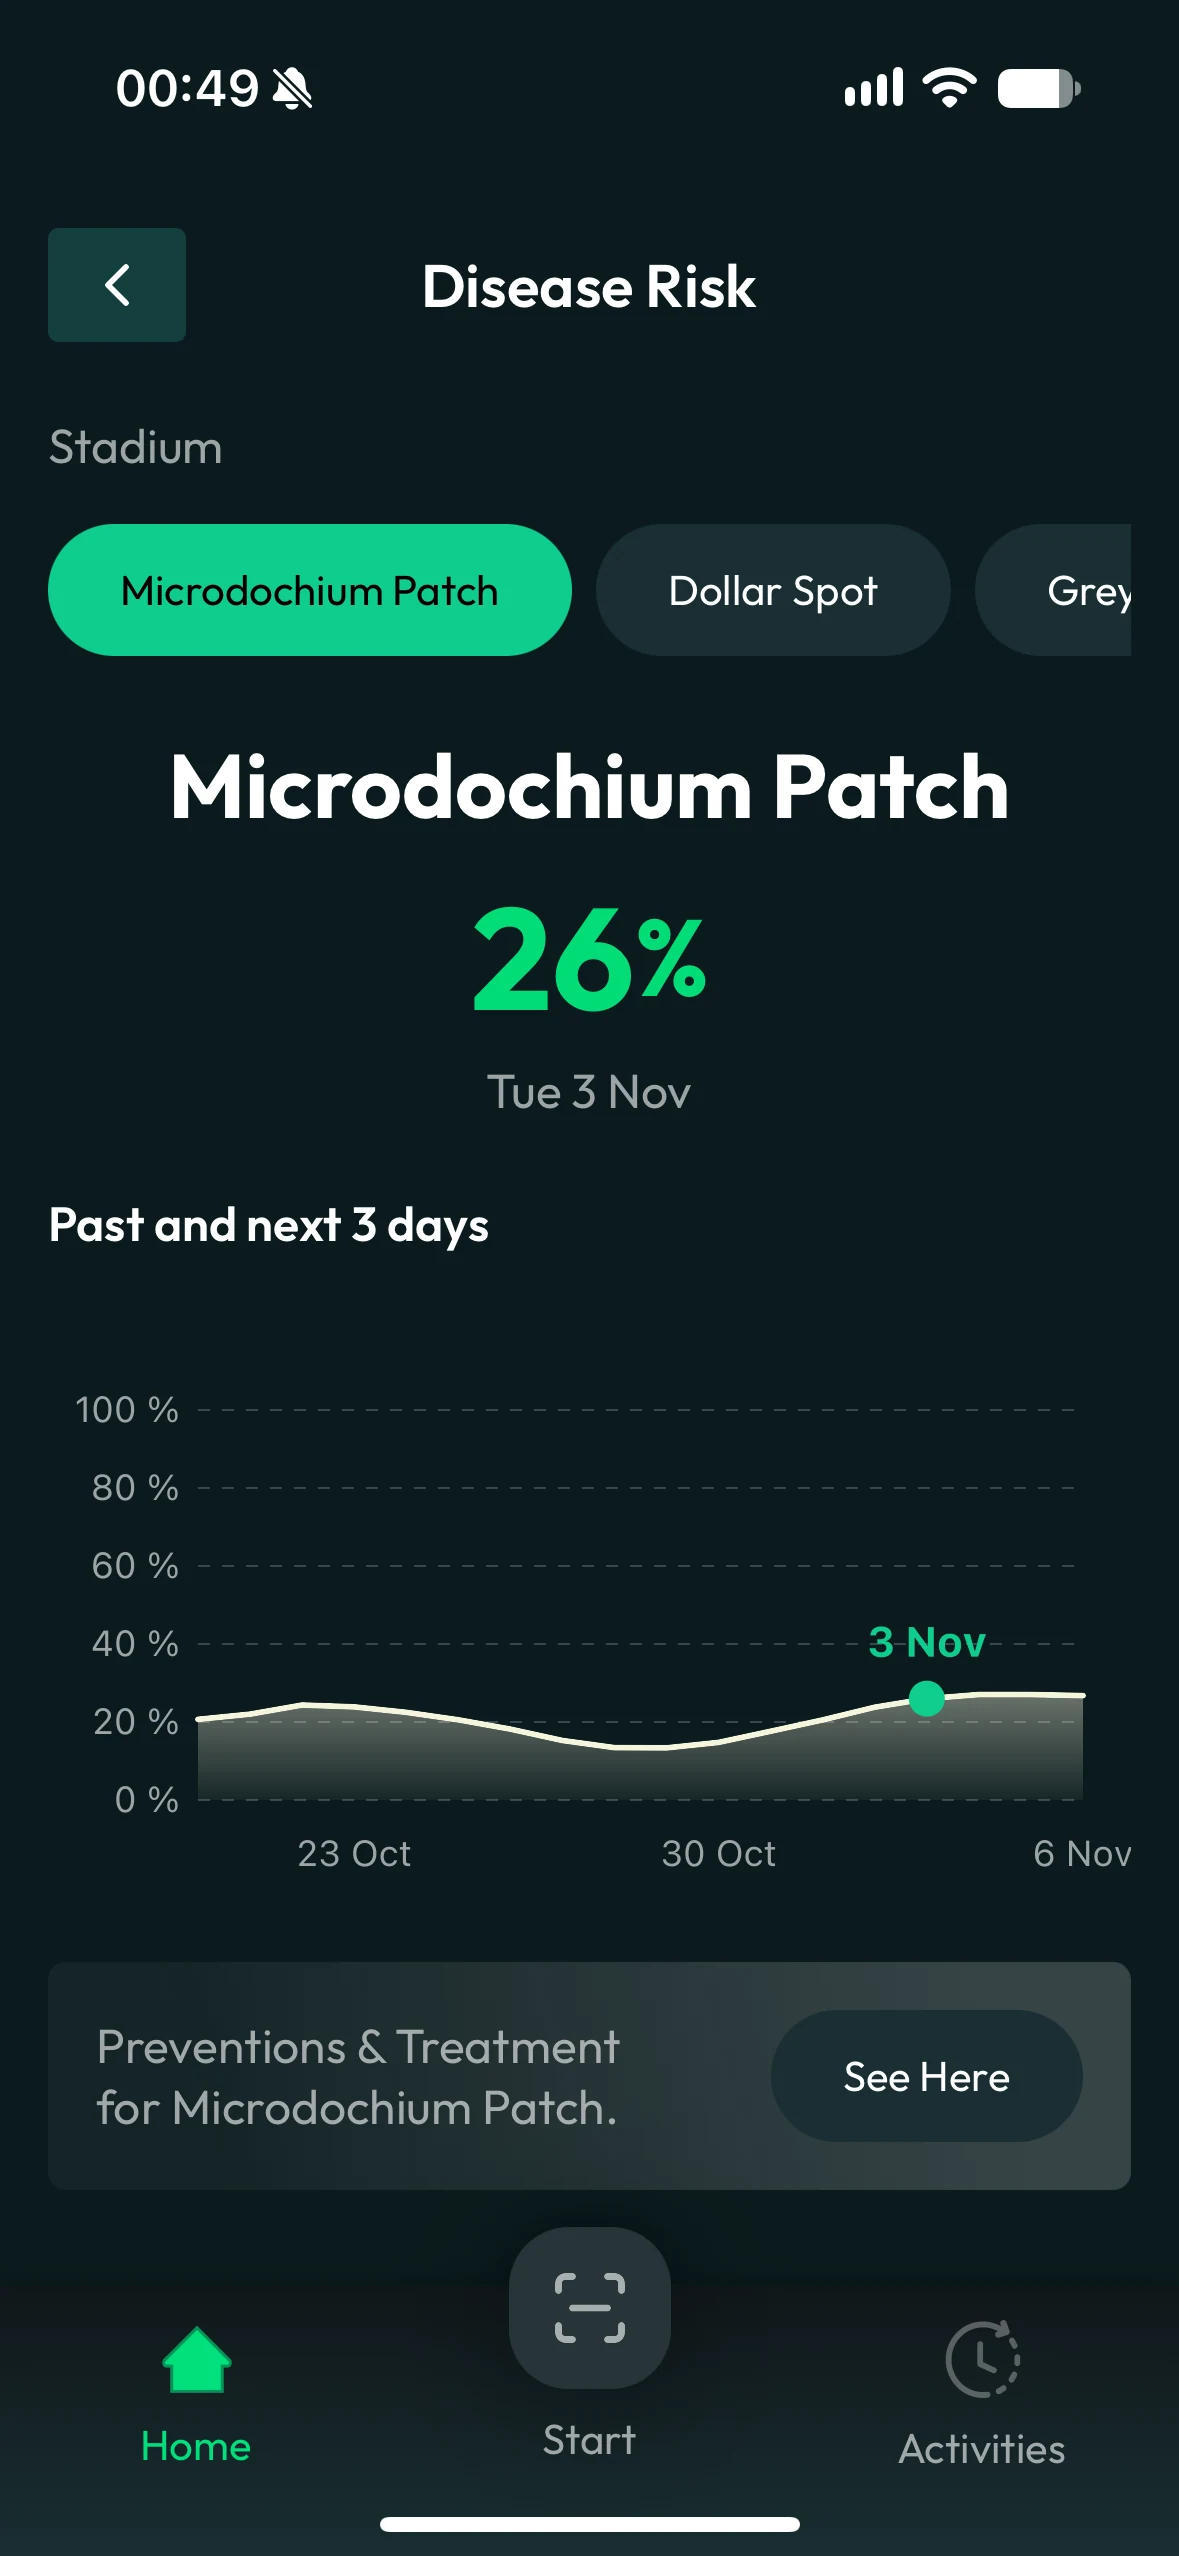
Head Greenkeeper Jan Naumann explains that the cooperation began with integrating the club’s local weather station and modelling disease forecasts for the training pitches. A real-time rain radar followed, giving the team more detail for planning around changing weather.
The weather station, disease forecast and rain radar answer related but different questions. The station records local conditions. The model helps the team consider disease pressure. The radar adds a view of approaching rain when the timing of the next job matters.
Jan describes the radar as a way to organise the day minute by minute. That makes the story more specific than simply having a weather forecast on a phone: the information is part of deciding when the team can carry out the work it has planned.
We started using Turfcoach because they offered to integrate our local weather station and model disease forecasts for our training pitches.
Make the reasoning visible.
Jan describes using the forecasts to help organise the day and respond to disease pressure. The practical value is in the connection: local conditions, the work being planned and the people deciding what the pitch needs next.
A forecast still needs to be read alongside the pitch itself. It directs attention to conditions worth checking; the grounds team brings observations of the grass and its experience of the site. This connection between a model and a person’s judgement is central to using the information well.
Wolfsburg’s example also shows an implementation that developed over time. Local weather and disease forecasts came first; radar added a more immediate planning view. The useful next feature grew from the grounds team’s daily work.